Birding with an AudioMoth: Setup and First Results
Table of Contents
I bought an AudioMoth microphone and have started identifying the birds by sound on my property.
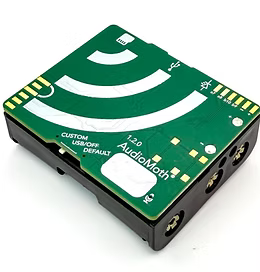
What is an AudioMoth?
A while back I watched this video from Benn Jordan about recording a PNG to a bird. It’s as wild and fun as it sounds. I’d recommend watching it. At the same time, I was in the process of buying a house in a wooded area. I was captivated by the hummingbirds when I toured the house the first time. The gears turned in my mind linking the video and the house, and I knew I wanted to try understanding the birds around my new house. In the video Benn Jordan describes various set ups, and I decided the fastest route to get going was this AudioMoth setup. So what is an AudioMoth?
Ripped straight from the OpenAcoustics website:
AudioMoth is a low-cost, full-spectrum acoustic logger, based on the Gecko processor range from Silicon Labs. Just like its namesake the moth, AudioMoth can listen at audible frequencies, well into ultrasonic frequencies. It is capable of recording uncompressed audio to microSD card at rates from 8,000 to 384,000 samples per second and can be converted into a full-spectrum USB microphone.
How I set up my system?
I bought the AudioMoth from GroupGets for $100 and the IPX7 waterproof case for it for an additional $45. I grabbed a micro SD card and was off to the races. It’s that simple. Throw some batteries and a card in it, and you can get started recording.
As a first experiment, I used the default settings and got some huge 4 gigabyte recording files. I had neglected to read any setup documents and was still able to capture something. The timestamps were all wrong on the files though, and it was a bit unwieldy at that size. So, I stepped back and read the setup guides and ran the setup configurator. I didn’t really change anything from the default in the setup configurator. With those few changes, I had proper timestamps (hooray!) and recorded 55 seconds of every minute into separate WAV files. Magic!
I selected a tree farther from the house and strapped it to a low limb. I left it to record for a bit.
What are my first results?
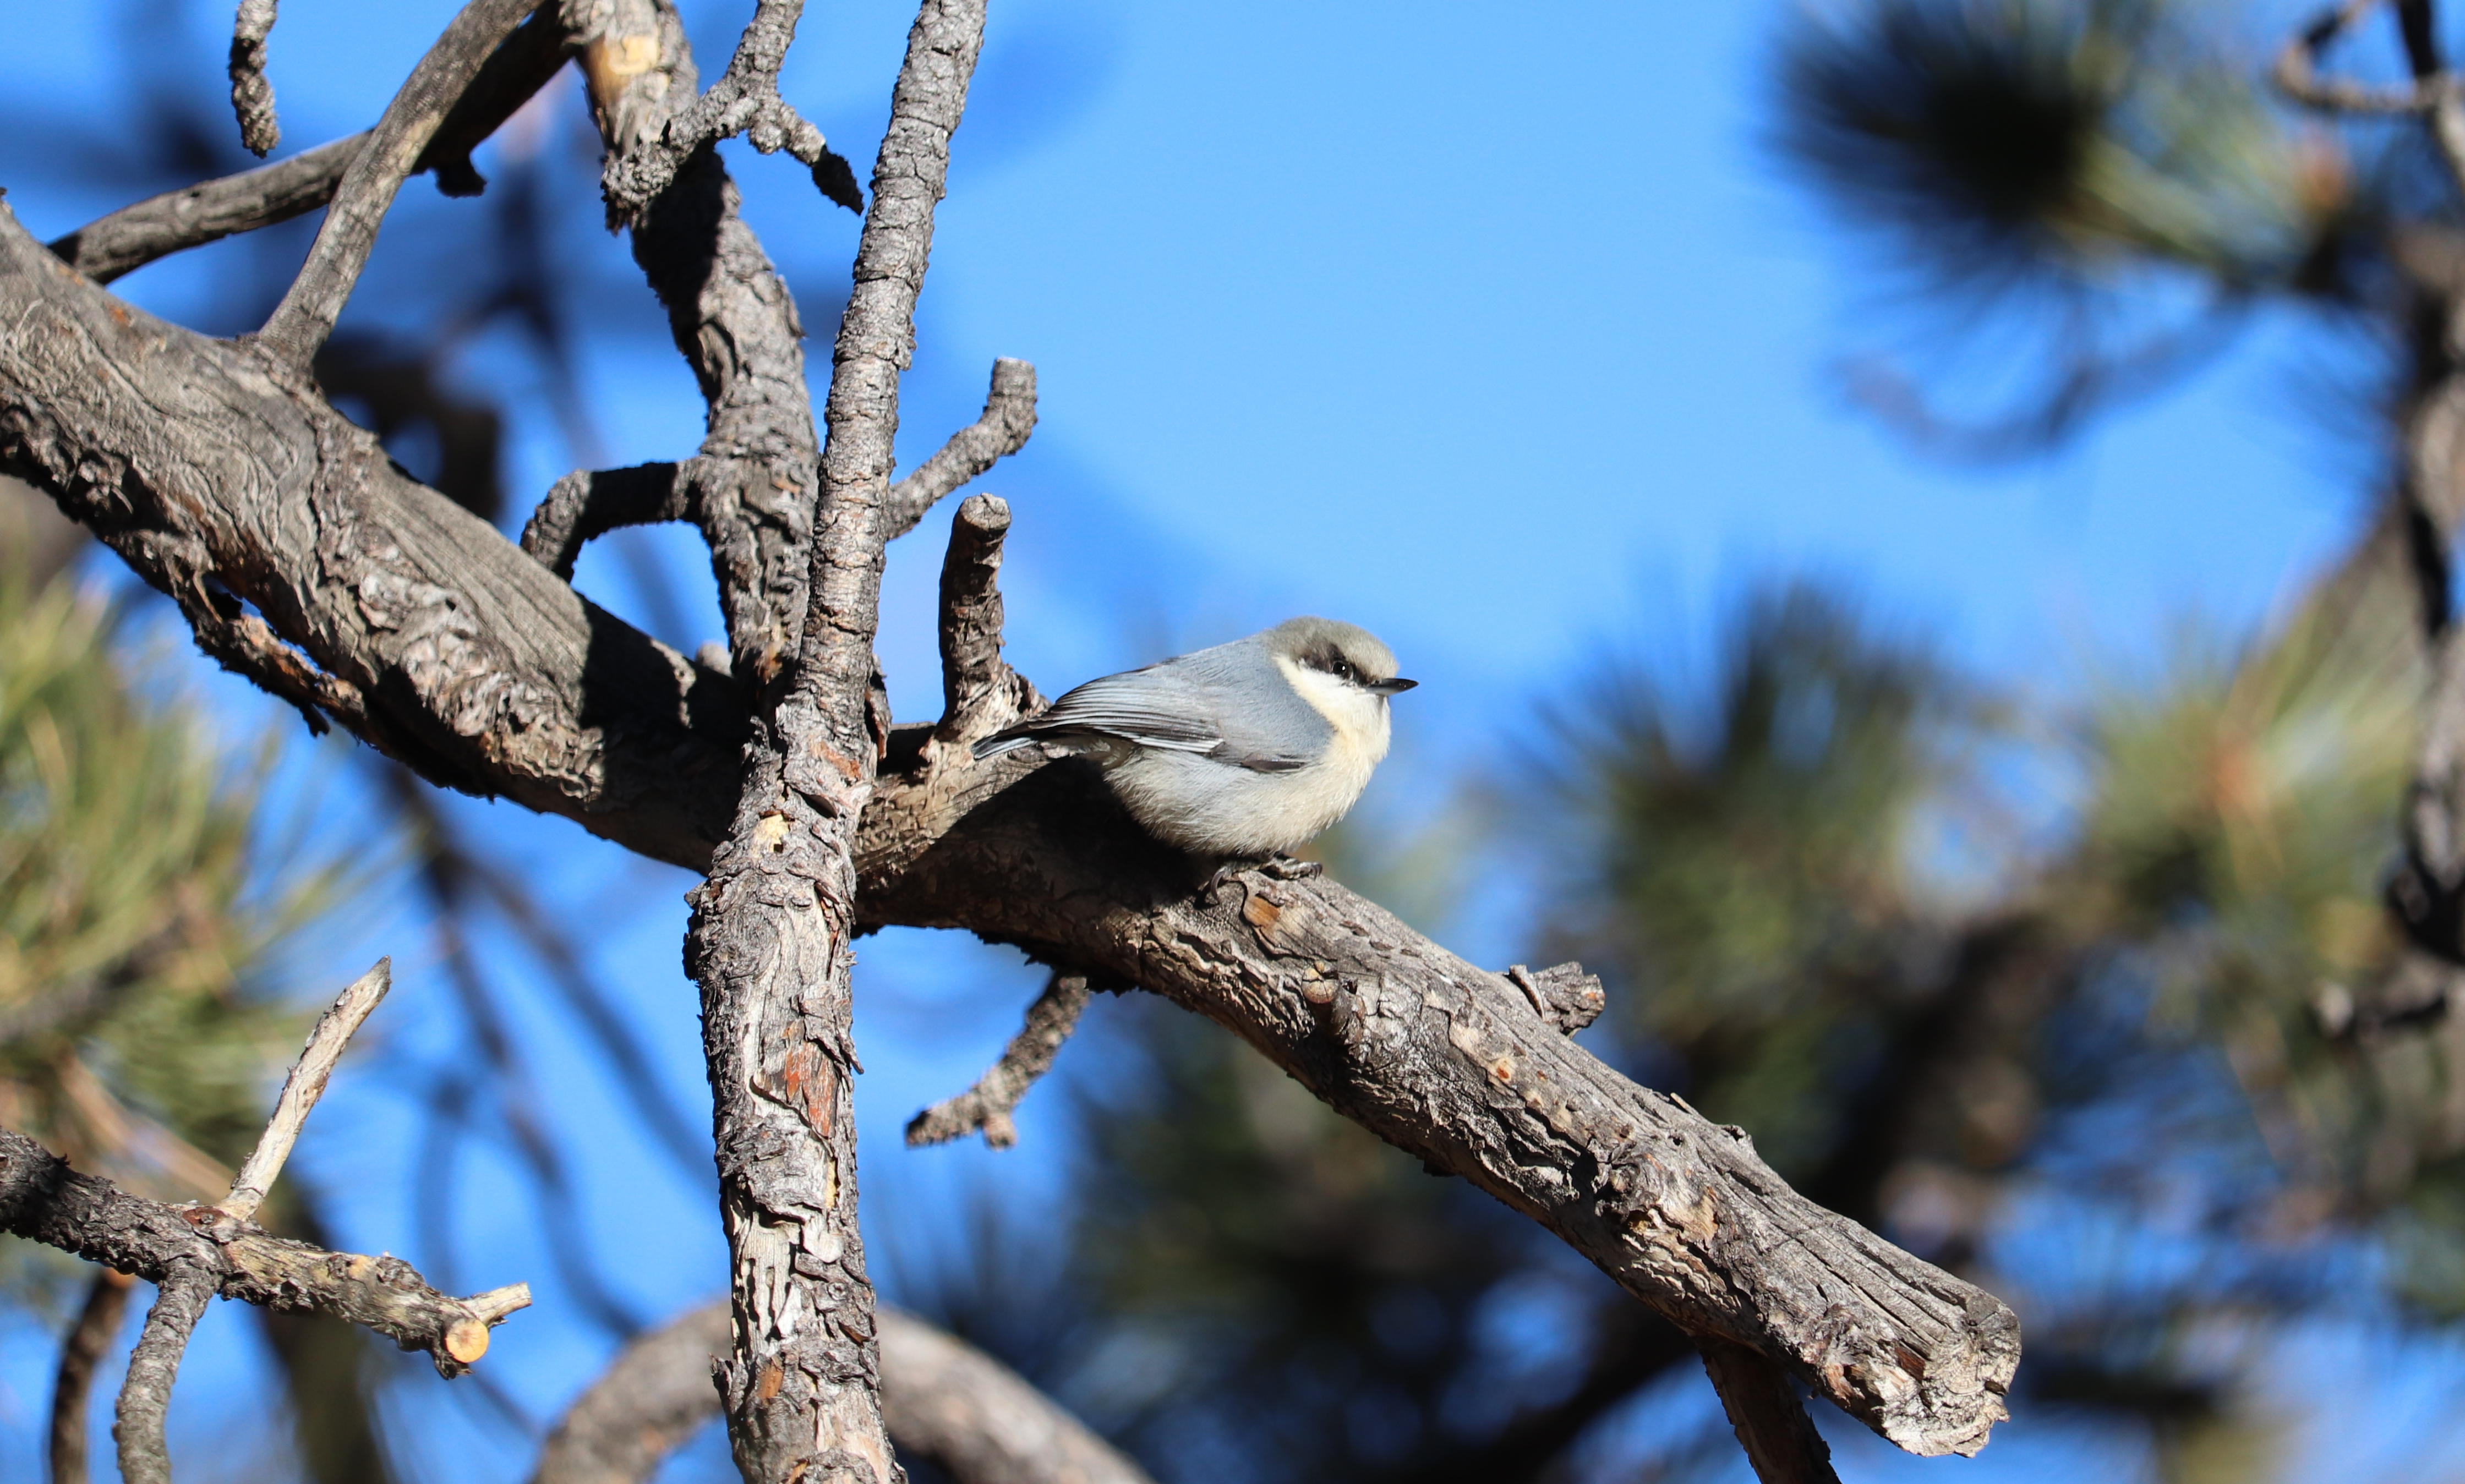
I had 2,543 recordings after that first session. Here’s the recording for one moment with some Pygmy Nuthatches:
It’s hanging out on the tree as I type now, so I’m getting thousands of more recordings. That’s too much audio to manually comb through. Enter machine learning and BirdNET! BirdNET is a machine learning model from the Cornell Lab of Ornithology that detects birds just by audio.
Labeling the audio
Even better, there’s a Python package that makes using BirdNET trivial. I simply pip install birdnet and was ready to classify. All my first audio lives in one folder on my computer, so I followed the package instructions and ran the following script:
import birdnet
model = birdnet.("acoustic", "2.4", "tf")
predictions = model.("/home/jmbhughes/safe/bird_audio/tree1")
predictions.("predictions.csv")I now had a spreadsheet that classified the bird species for each three second snippet in each file.
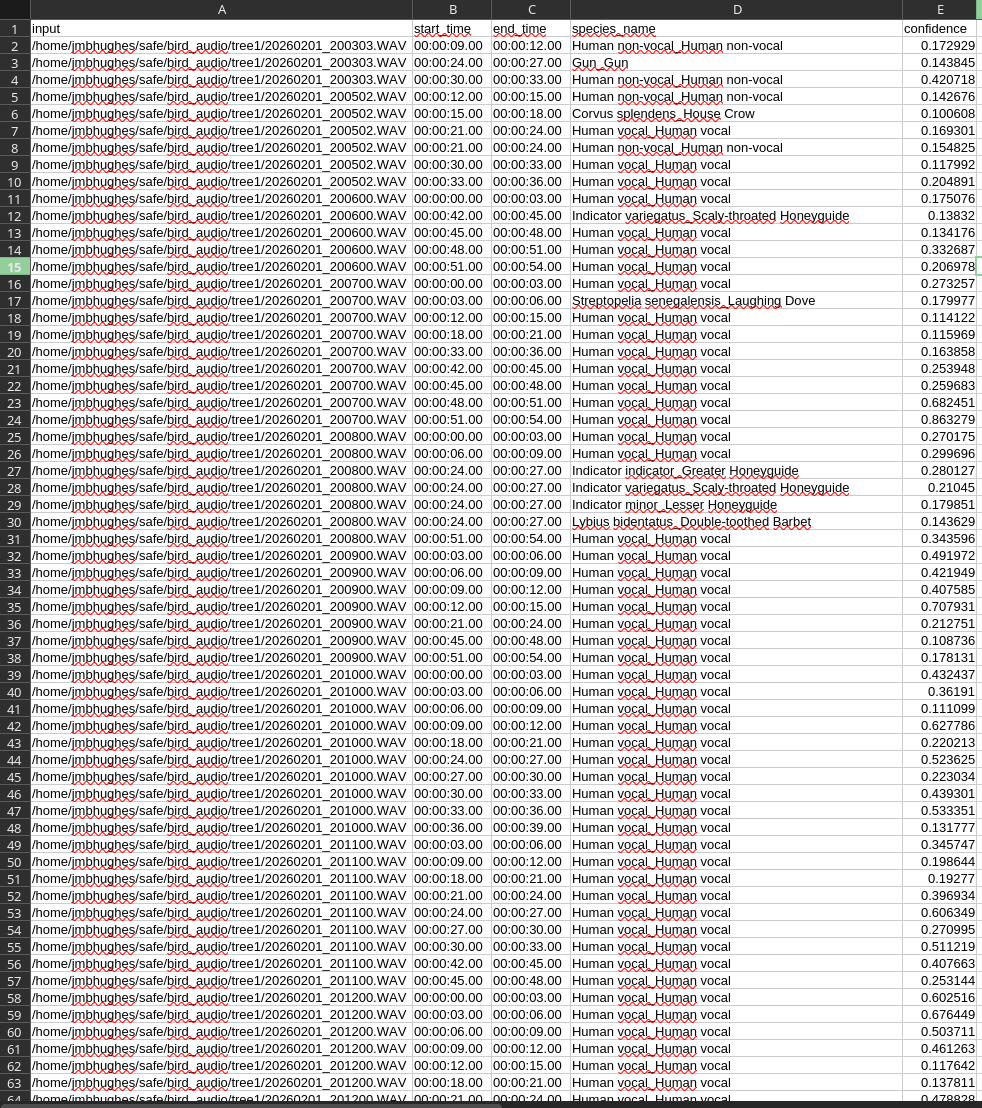
You can see in the picture it starts with human voice because I was talking to a friend before putting it out on the tree. If I scroll down in the spreadsheet, I start seeing bird species with their confidences. I listened to some recordings and used my knowledge of local bird sounds to see if the labels made sense. The ones with high confidence scores seemed plausible.
First pass at plotting
I was ecstatic that I could go from audio to labels that easily. It was time to start analyzing the data! I wrote a quick script that loaded that spreadsheet and rendered a quick plot:
from collections import Counter
import matplotlib.pyplot as plt
from datetime import datetime, timezone
import matplotlib.dates as mdates
import pandas as pd
from zoneinfo import ZoneInfo
import numpy as np
# load the data and only keep the classifications we're confident in
df = pd.("predictions.csv")
df =[['confidence'] > 0.8]
freq =(['species_name'])
# we'll only keep species that have at least 10 labels
species_list = [k for k,v in freq.() if v > 10]
# we'll aggregate statistics into 15 minute chunks to make it more manageable
frequencies = pd.()
SAMPLE_RATE = 15 # minutes
# this will be our index since it spans the full time period
custom_index = pd.(start='2026-02-01 00:00:00',
end='2026-02-04 00:00:00',
freq=f'{}min').("US/Mountain")
final_df = frequencies.(, fill_value=0)
# do some wrangling for each species to put it in a frequency table
for i, chosen_species in enumerate():
occurrences =[['species_name'] ==]
time_str =['input'].str.("/").[-1]
time_dt = pd.(, format="%Y%m%d_%H%M%S.WAV").dt.("UTC")
local_times = time_dt.dt.("US/Mountain")
local_times.index = pd.()
counts = pd.().(f"{}min").()
counts = counts.(, fill_value=0)
[] =['input']
# now it's time to plot!
fig, ax = plt.()
for chosen_species in species_list:
ax.(.,[], '.-', label=.("_")[1])
ax.("Local time on 2026-02-01")
ax.(f"Call count in {} minute window")
time_format = mdates.('%Y/%m/%d %H:%M:%S', tz=("US/Mountain"))
ax.xaxis.()
fig.()
ax.(((2026,2,1,13,0, tzinfo=("US/Mountain")),(2026,2,3,7,0, tzinfo=("US/Mountain"))))
fig.(loc="upper right")
plt.("time.png", dpi=300)That resulted in a plot like this:
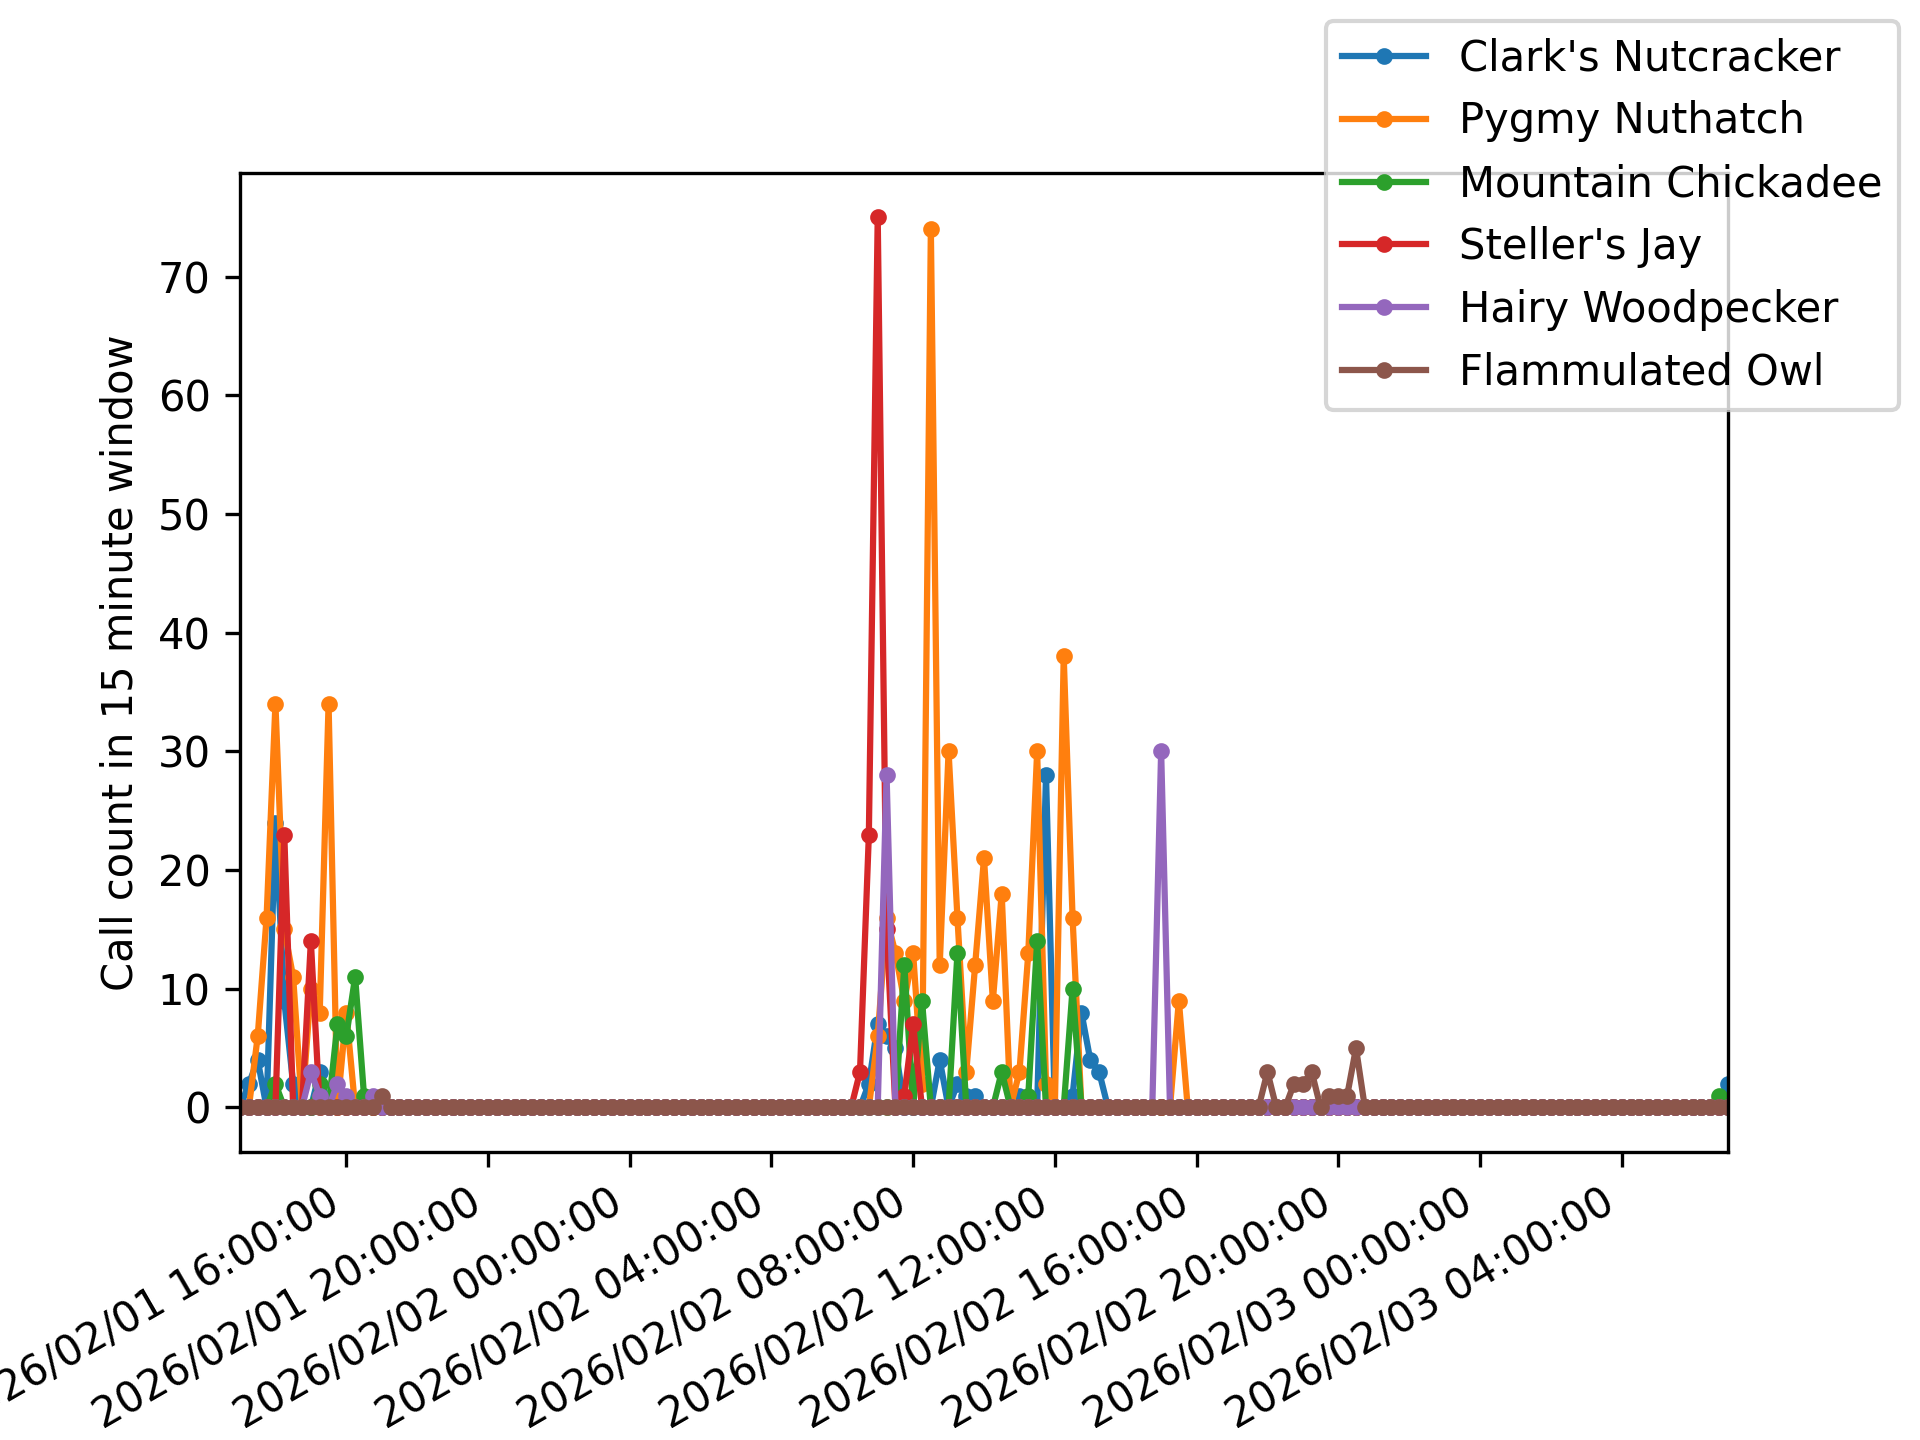
It’s a bit of an ugly plot. We’ll solve that later, but for now let’s bask in the glory of bird sound time series! From experience watching the birds at my house, I expected Clark’s Nutcrackers, Pygmy Nuthatches, Mountain Chickadees, and Steller’s Jays. I had seen a few woodpeckers, but they were rare sights at my feeders, so I was happy to pick them up too. The surprise was the Flammulated Owl. I’m not convinced I actually have one. When I listen to the audio, it sounds like dogs barking. It’s not like the recordings I find online. So, we’ll have to follow up more on that.
I haven’t shown it on the plot here, but BirdNET also labeled some clips as coyote sounds. They’re eerie to hear. Here’s a clip:
There were lots of other birds that got excluded by my 0.8 confidence and >10 count filtering. It’s possible some of them are real, but for now I’m looking for the obvious and clean signal. Later, I want to dive into the possible rare signals and see if I can distinguish them from mislabeling.
Converting to a heat map
I took the code from before and appended a bit more to make a heat map of the bird sounds.
# heat map
image = np.((len(), len()))
for i, chosen_species in enumerate():
[] =[]
fig, ax = plt.(figsize=(8, 2))
ax.(, vmin=0, vmax=25, cmap='Blues')
ax.(20)
ax.(range(len()), [.("_")[-1] for in])
ax.(range(.[1])[::.[1]//8],[::.[1]//8].("%Y/%m/%d %H:%M"))
fig.()
plt.("heatmap.png", dpi=300, bbox_inches='tight')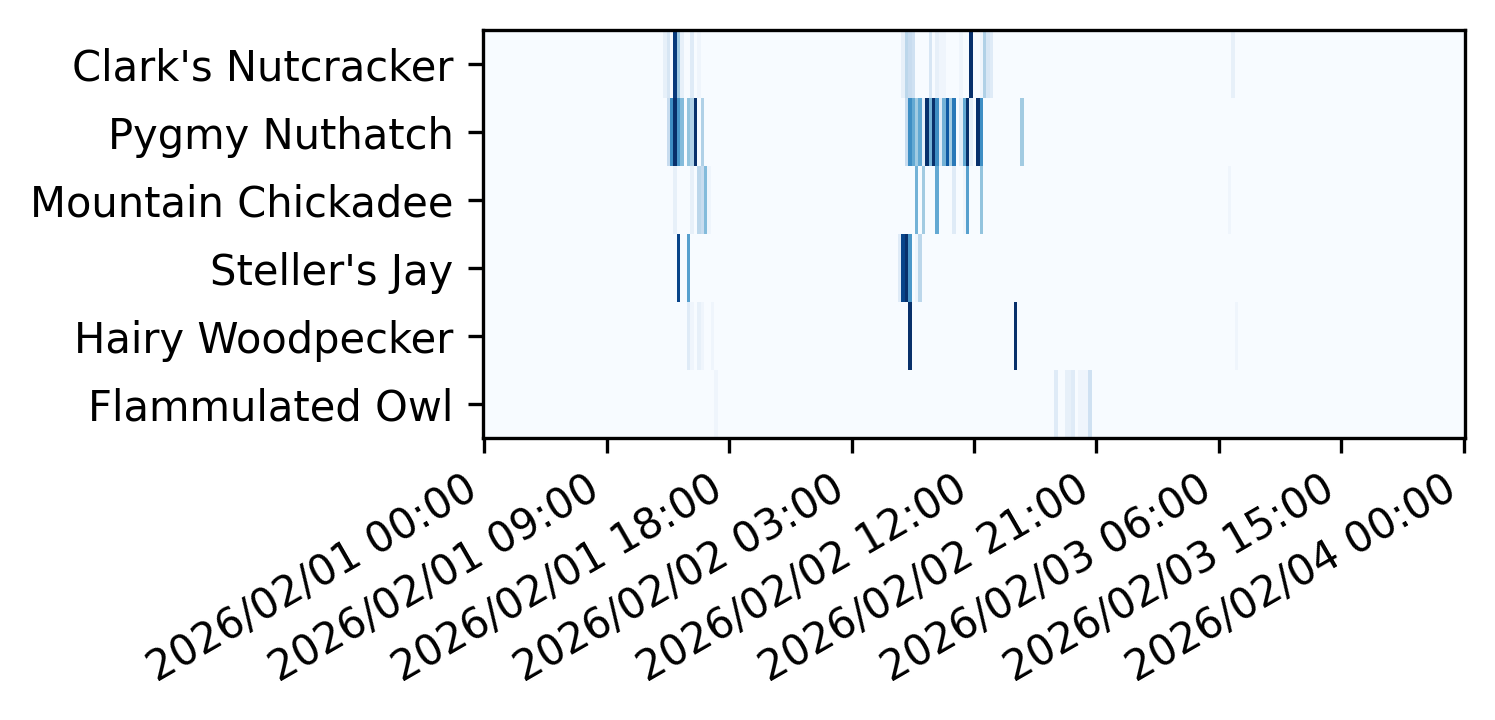
It’s a bit easier to digest than the line graph because they don’t overlap as much. Darker lines indicate when there were more of that bird call.
Making clock plots
I want to answer questions I have about bird behavior instead of just plotting a long time series. I started with a simple question: what time of day is a certain species most active? To answer this question, we can make what I’m calling 24-hour clock plots. They’re polar plots where the fractional frequency is aggregated over the time of day instead of the full time.
# clock plots
for species in species_list:
hourly_avg = frequencies.(..)[species].()
hourly_rate = hourly_avg / np.()
fig = plt.()
ax = fig.(projection='polar')
ax.(. * (2*./24),, width=(2*./24),linewidth=2)
ax.(.(0, 2*., 24, endpoint=False))
ax.(range(24))
ax.(-1)
ax.(./2.0)
ax.(f"Hourly Call Distribution of {.("_")[-1]}")
plt.(f"clock_{}.png", dpi=300, bbox_inches='tight')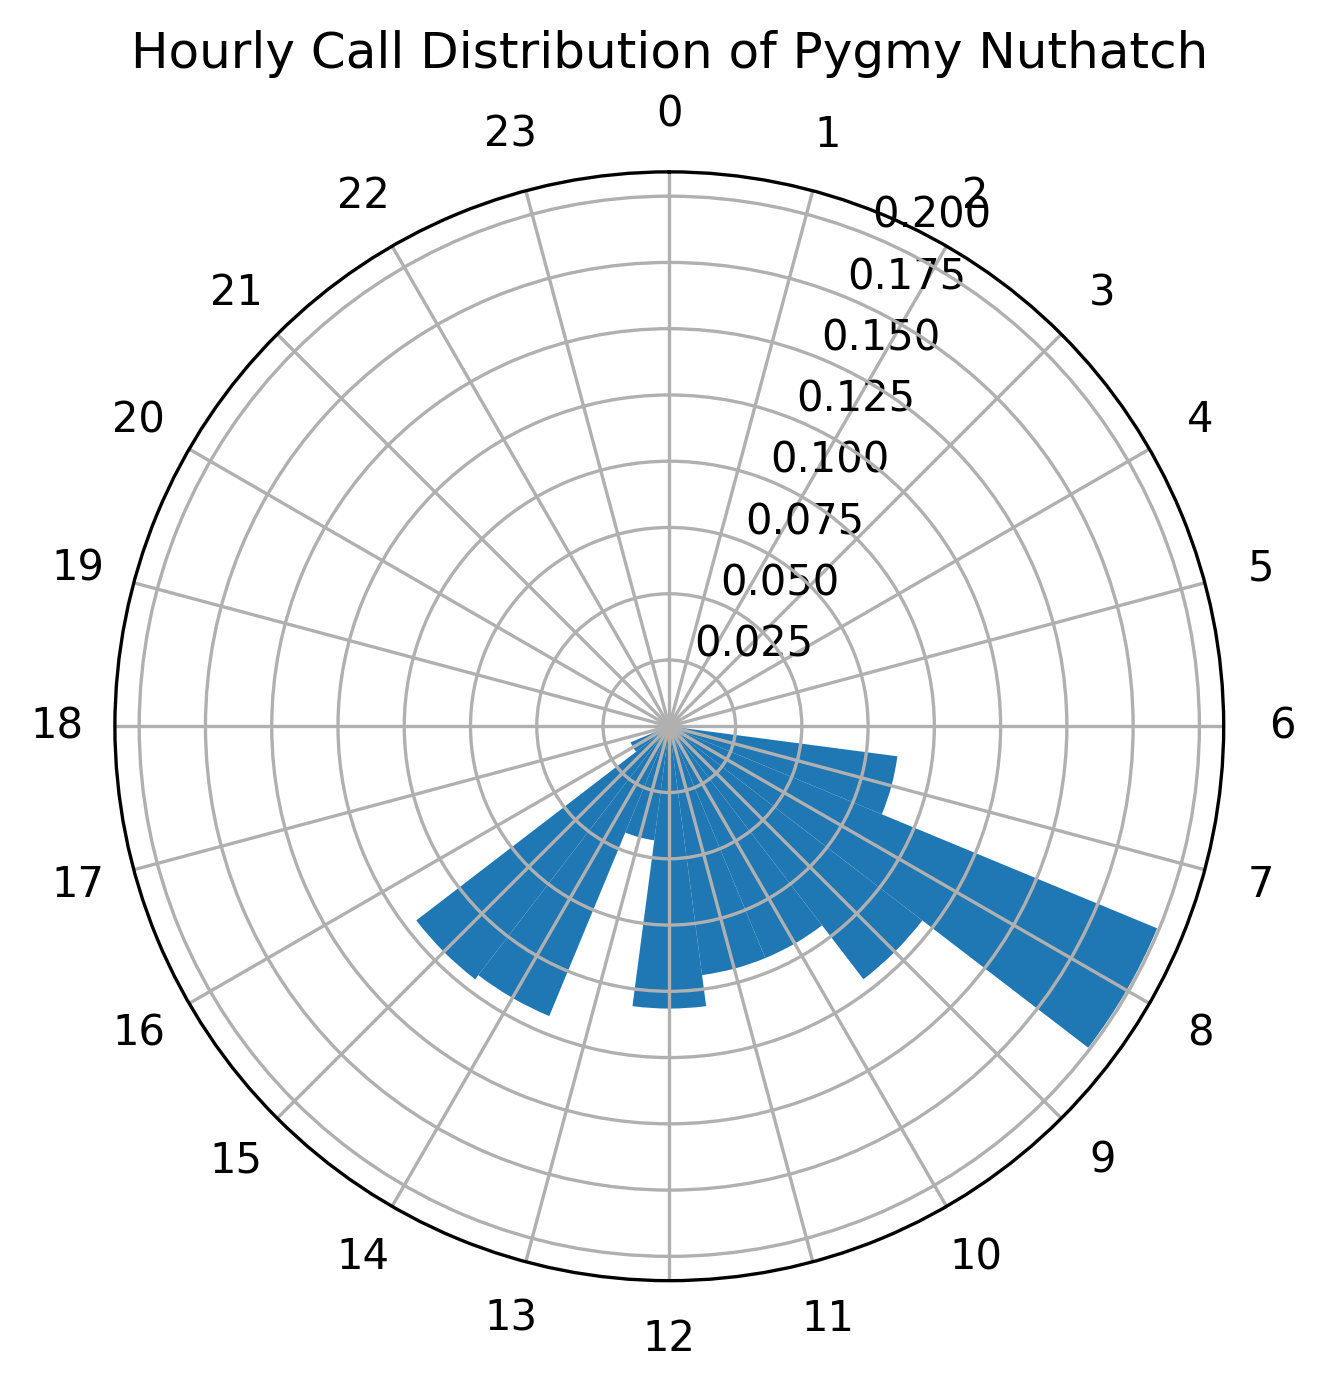
We can readily see the Nuthatches are most active around 8am (according to this very limited data set).
We can compare that to the Clark’s Nutcrackers and the (possible detection) of Flammulated Owls:
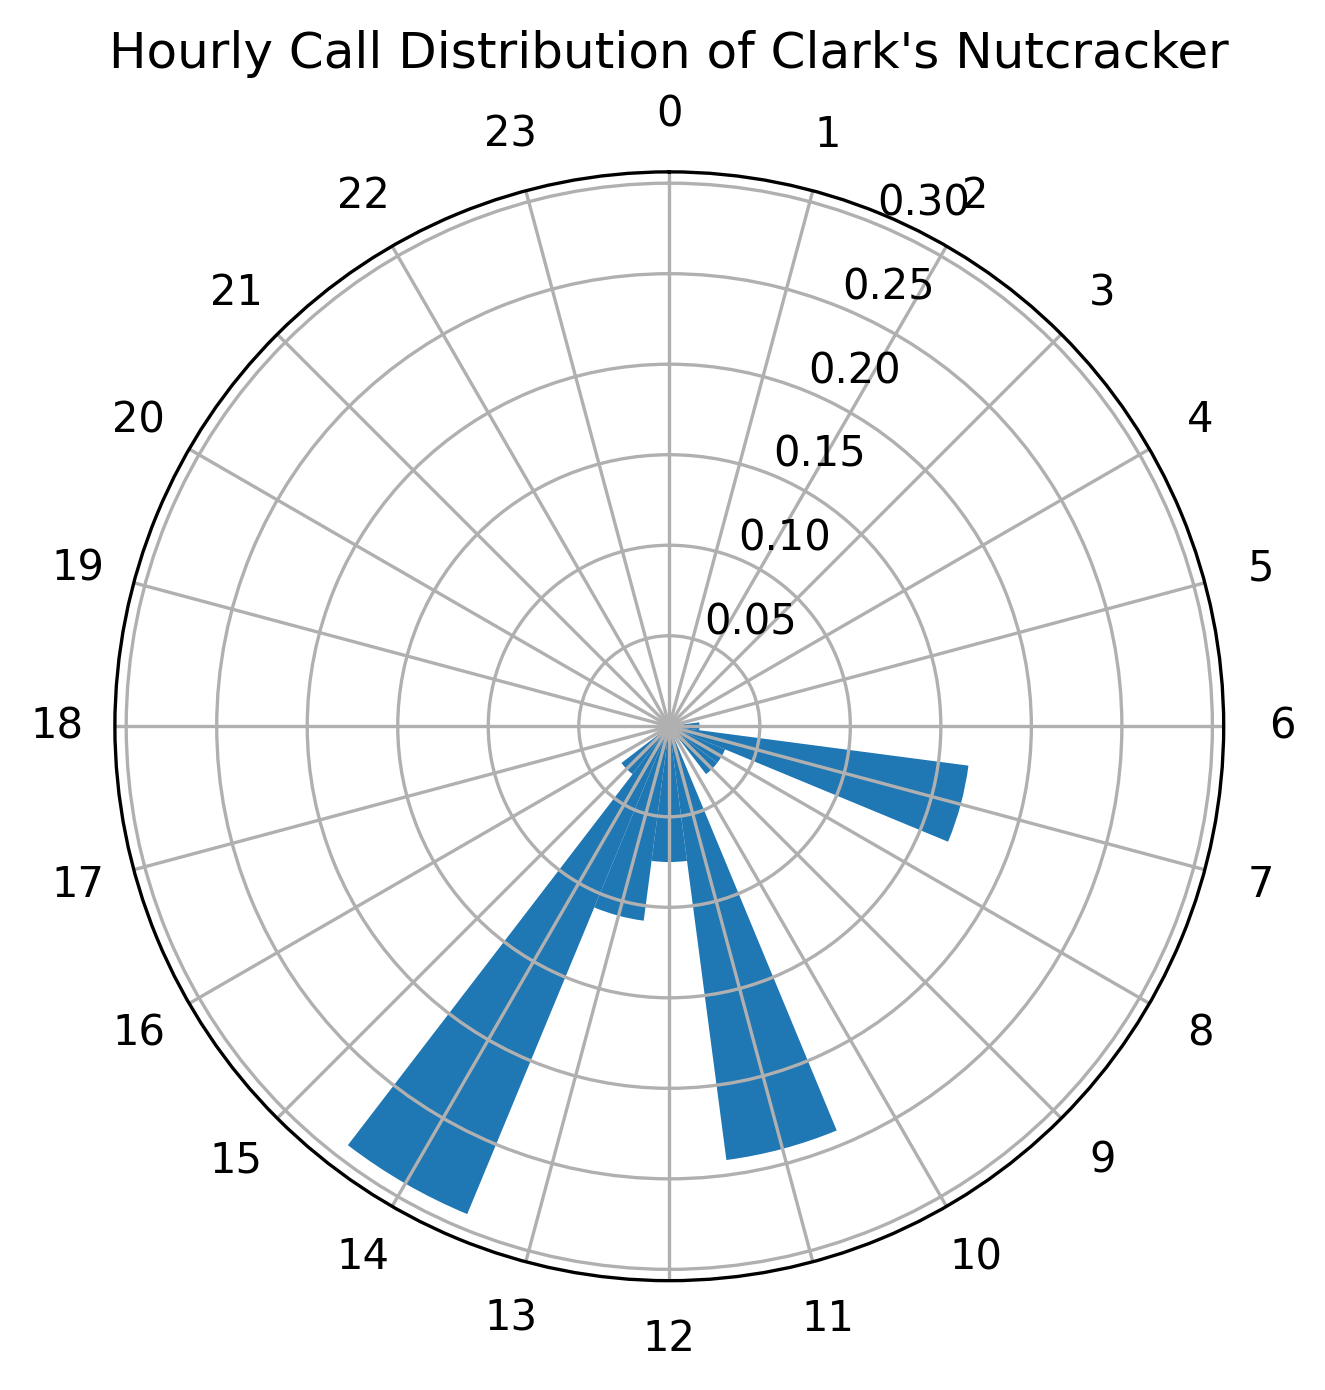
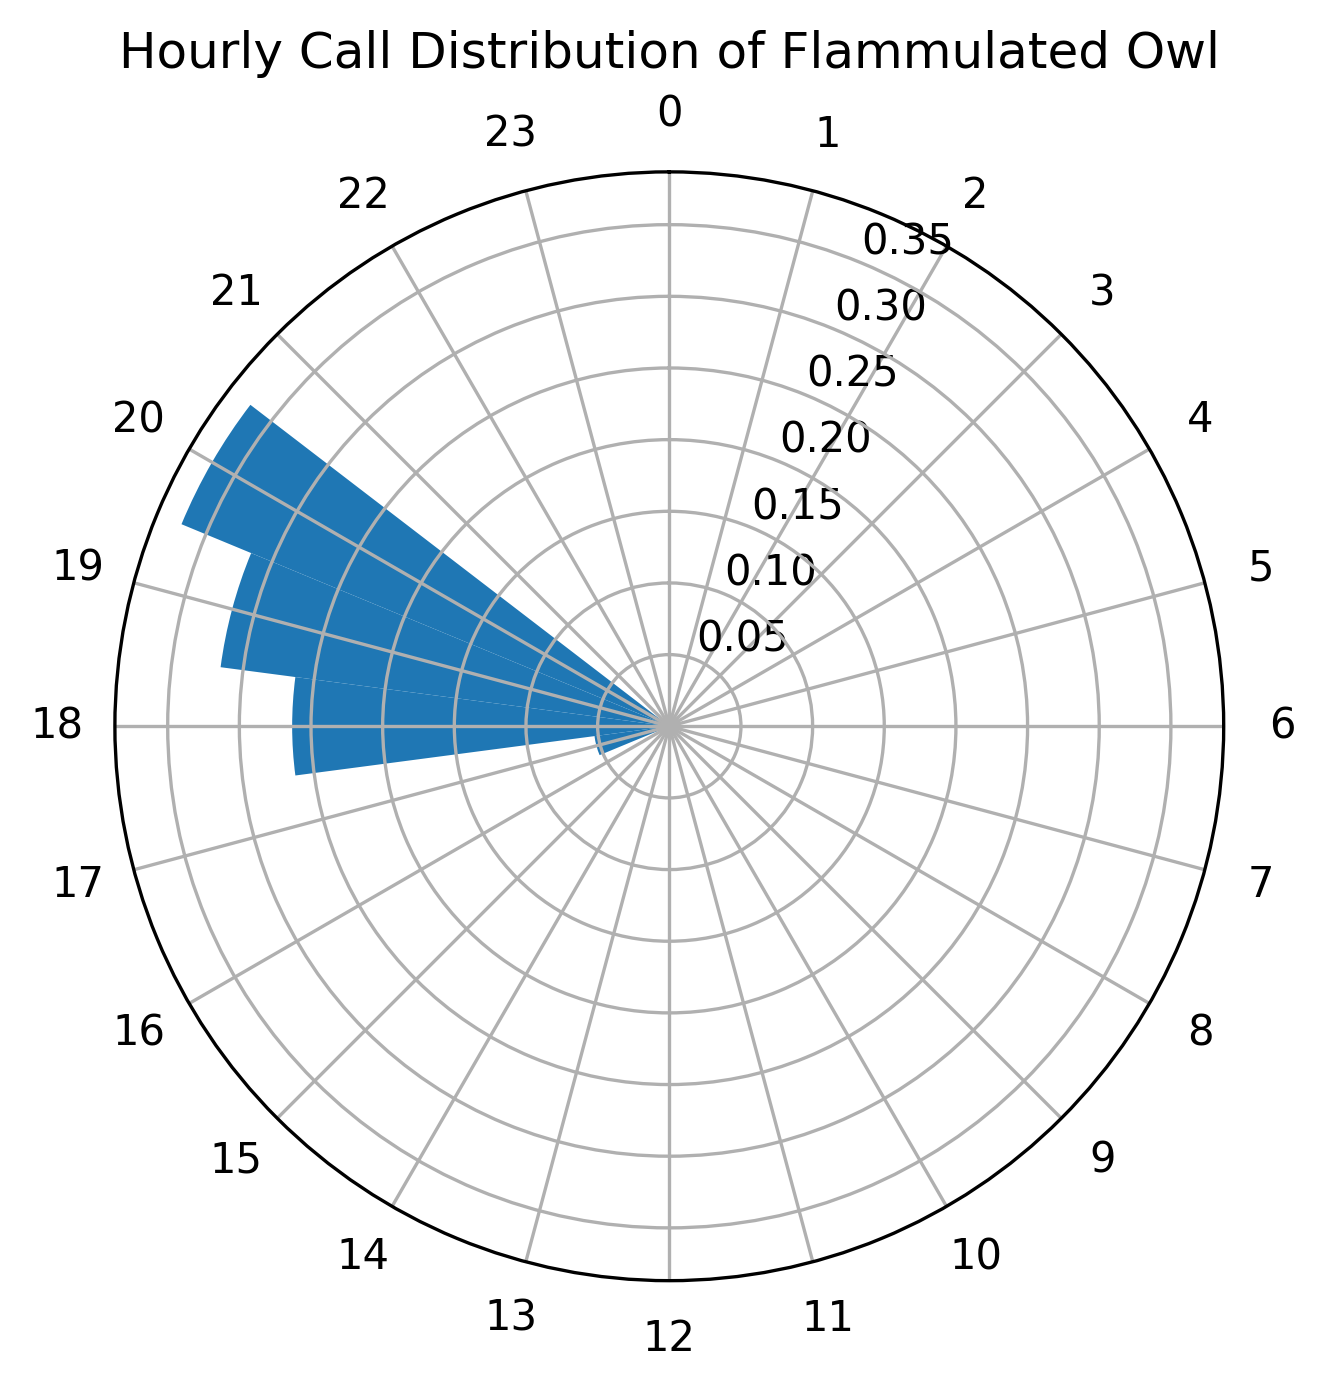
Obviously for reliable understanding of behavior I’ll need more data, but it’s an exciting start.
What are my future plans?
So where am I headed with this project? I’d like to understand and answer many more questions about the birds on my property:
- What birds are present in other seasons?
- Do I have specific birds that migrate through the property at certain times?
- Does the presence of one bird species indicate another will be more silent? Or who chirps with who? Or does a Steller’s Jay scare away smaller birds for a bit?
- How does schedule for bird song for a species change throughout the year?
- Are there any bird species in my yard I haven’t seen with my eyes, like the Flammulated Owl?
- Do different spots on my property attract different kinds of birds? Some spots have different trees after all.
- Is bird behavior correlated with the weather in a given season? When it’s rainy or cold are birds quieter?
- So many more questions!
I might be able to Google the answer to some of these questions, but where is the fun in that?
Hopefully this is just the first of many bird posts! It’s such a rewarding hobby.
I plan to organize and open source all my code eventually. For now, enjoy this Pygmy Nuthatch photo.