
James Marcus Hughes
Friday, May 20, 2022
SUVI calendar heatmap
Introduction
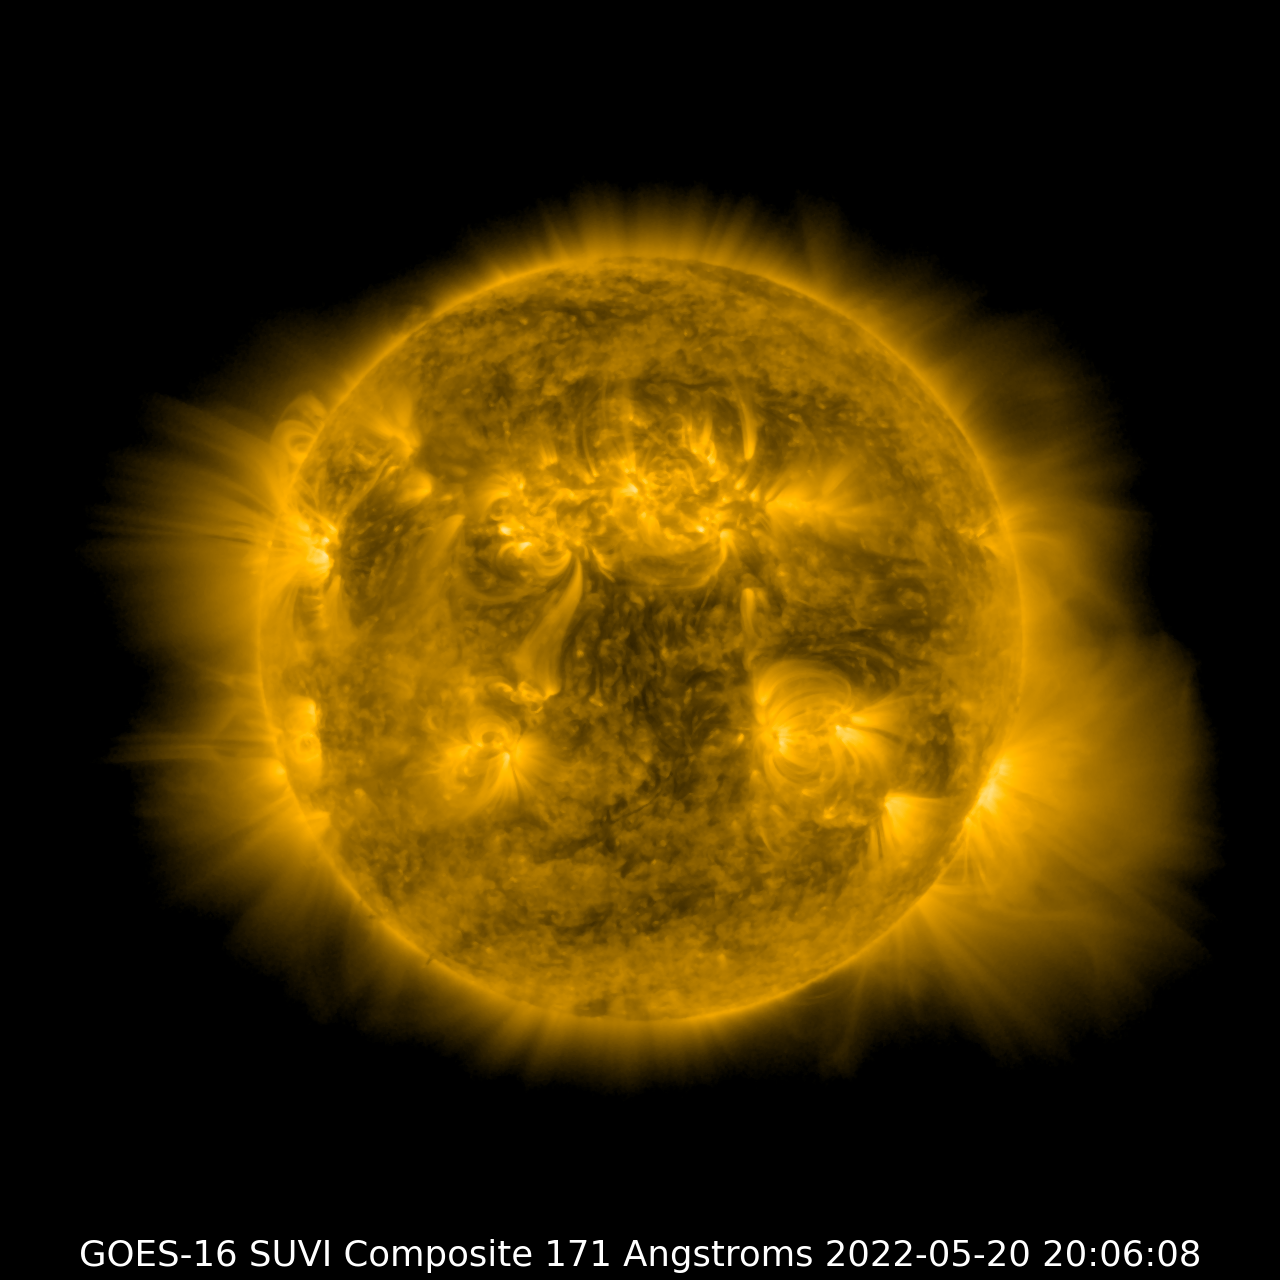
The Solar Ultraviolet Imager (SUVI) aboard NOAA’s GOES takes pictures of the Sun in 6 ultraviolet passbands. They’re quite stunning and are used for space weather monitoring and prediction. (I was lucky enough to get to work with them in my previous job at NOAA.) To make them more useful, the imager takes long and short length exposures and then composites them together as a Level 2 composite image product. You can see one below.
However, the composite images are sometimes not created, meaning no data is available for the end-user (ME!). I wanted to understand what periods the data was available for so I could use it for another project. A while back I wrote a piece of code called the goes-solar-retriver that allows a user to search for SUVI images and then download them directly from NOAA. To answer my question, I queried the website for all the data using the code shown at the end. The process is slower than I’d like because there’s no multi-threading in my retriever software. I feel like it’s also slow because of other undetermined reasons too.
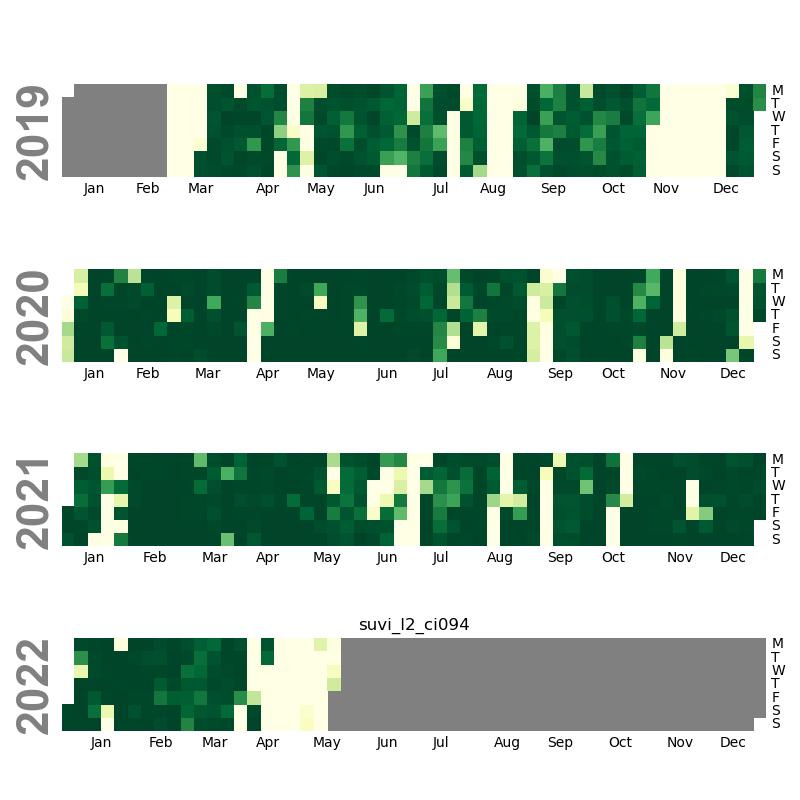
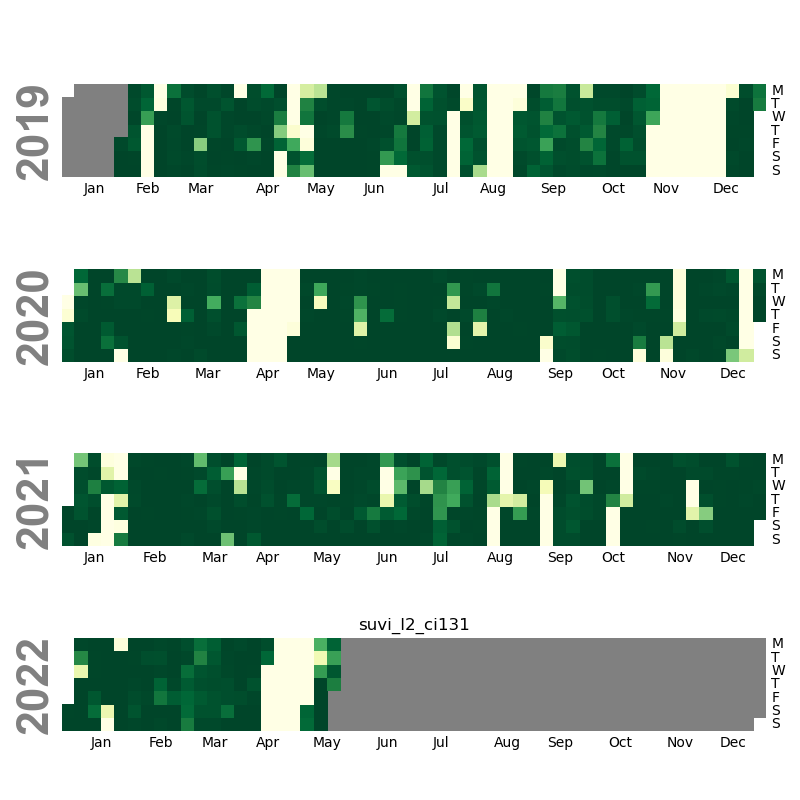
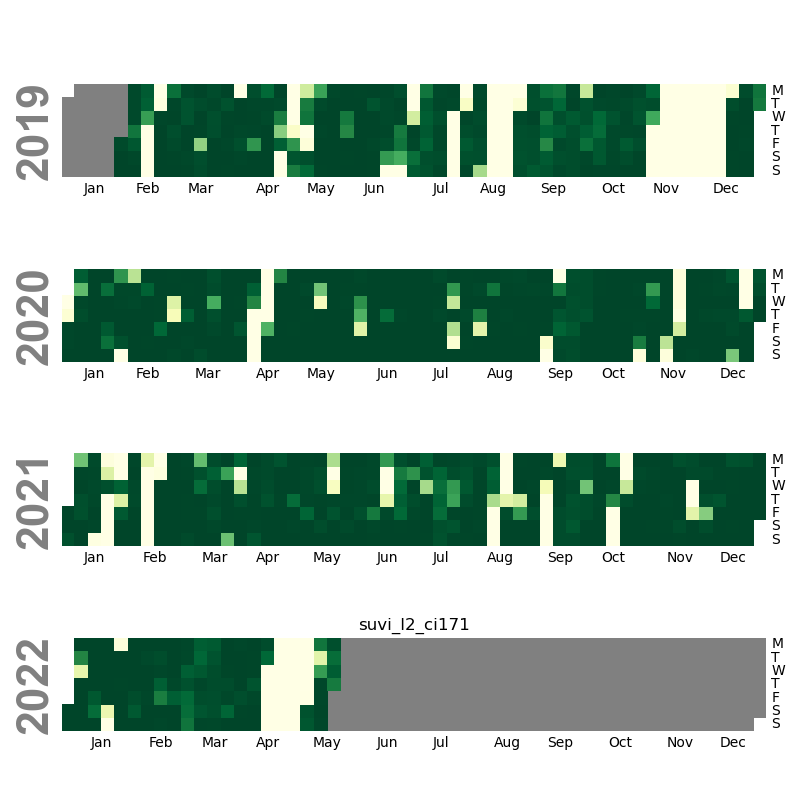
From that catalog of all the images, I then used the Python package calmap to create calendar heat maps of the frequencies.
Results
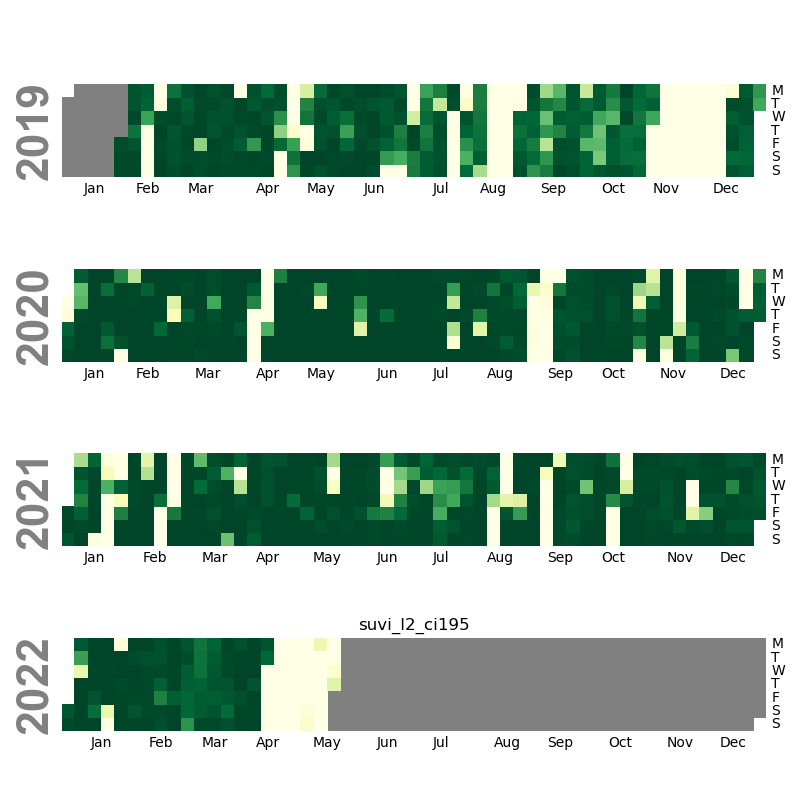
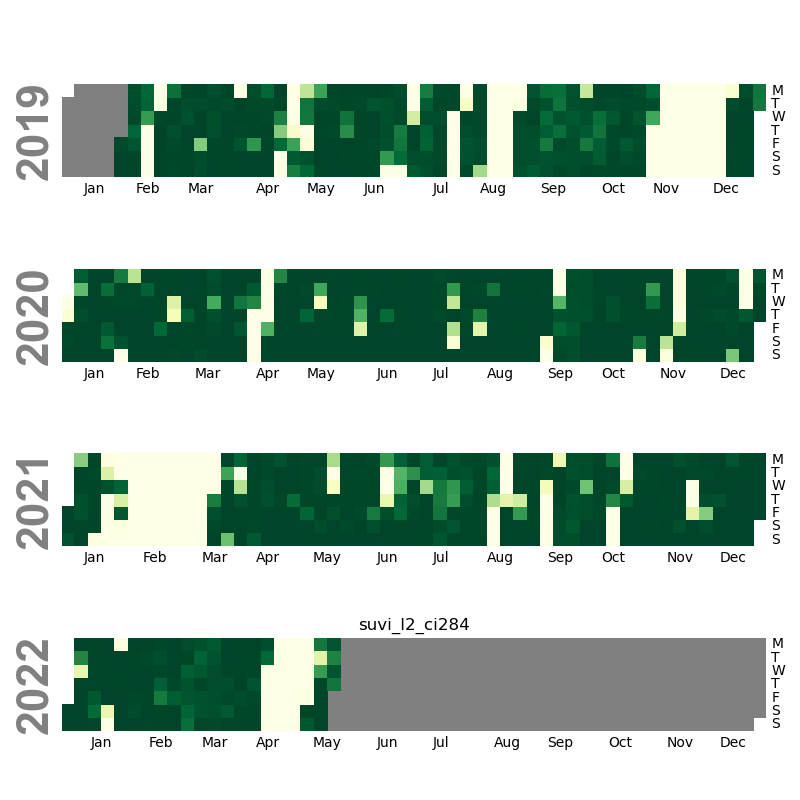
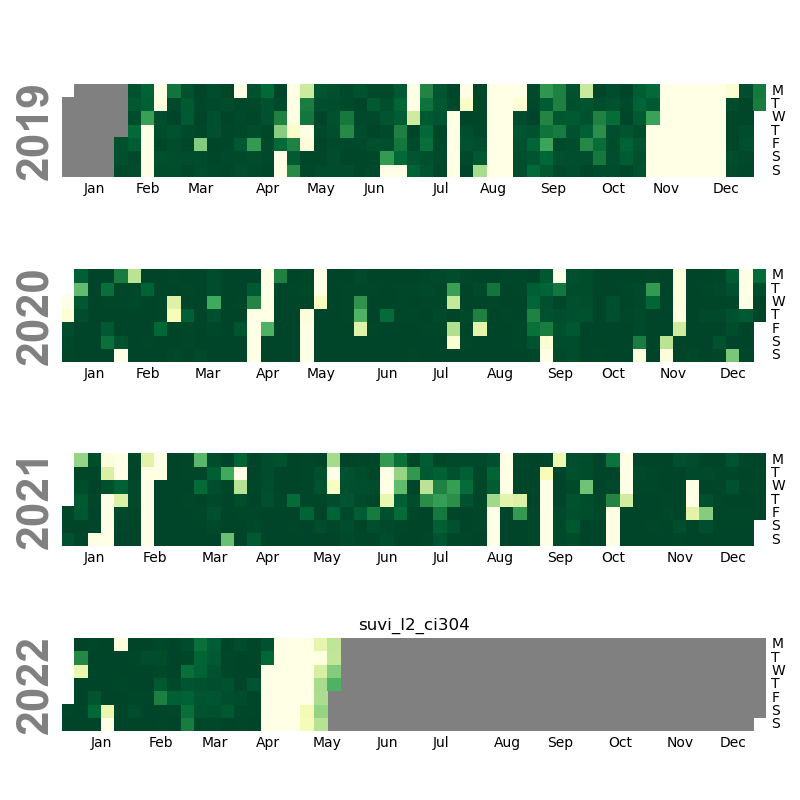
Deep green means 360 images were created on that day, the expected amount. Anything yellower or whiter than that has fewer images. Grey means no data was retrieved because it was outside the search window. All of these results are for GOES-16 composite images.
94 angstrom
131 angstrom
171 angstrom
195 angstrom
284 angstrom
304 angstrom
Potential improvements
As mentioned before, the code is slow. It takes about 15 images to create a single plot. This should be improved.
The plots are good for getting an impression of when data is available, but it would be much better if they were interactive so that you can hover over and determine exactly how many images are available on a given day. It could even directly take you to a preview of that day’s data. I could even have it allow for a more granular view showing when during that given day the data is available. Switching this plot to interactive would greatly enhance it.
Further, just because an image is available doesn’t mean it’s useable. There are
times of eclipsed data or potentially where the composite wasn’t created correctly,
e.g. missing blocks or improper combination of short and long exposures.
This project is only a start at understanding the data availability. A more
thorough quality check would need to be devised, but that requires actually
downloading the data.
Code
Below is the code used in this analysis:
import matplotlib.pyplot as plt
from goessolarretriever import Product, Satellite, Retriever
import calmap
from datetime import datetime, timedelta
import humanfriendly
import pandas as pd

start = datetime(2019, 1, 1)
end = datetime(2022, 5, 20)
satellite = Satellite.GOES16
products = [
    Product.suvi_l2_ci094,
    Product.suvi_l2_ci131,
    Product.suvi_l2_ci171,
    Product.suvi_l2_ci195,
    Product.suvi_l2_ci284,
    Product.suvi_l2_ci304
    ]

for product in products:
    r = Retriever()
    results = r.search(satellite, product, start, end)
    results['day'] = results['date_begin'].dt.date

    # only count files that are large enough, i.e. greater than 1 megabyte
    results['file_size_int'] = results['file_size'].apply(humanfriendly.parse_size)
    results['count'] = 1
    results['count'][results['file_size_int'] < humanfriendly.parse_size("1M")] = 0

    # aggregate the files into a daily count, i.e. sum how many observations there are per day
    daily_counts = results.groupby("day")['count'].sum()
    daily_counts.index = pd.to_datetime(daily_counts.index)

    # make a plot!
    calmap.calendarplot(daily_counts, monthticks=1, daylabels='MTWTFSS', cmap='YlGn',
                        fillcolor='grey', linewidth=0,
                        fig_kws=dict(figsize=(8, 2)), vmin=0, vmax=360)
    plt.savefig(str(product).split(".")[-1] + ".png")
comments powered by Disqus