
James Marcus Hughes
Wednesday, March 27, 2019
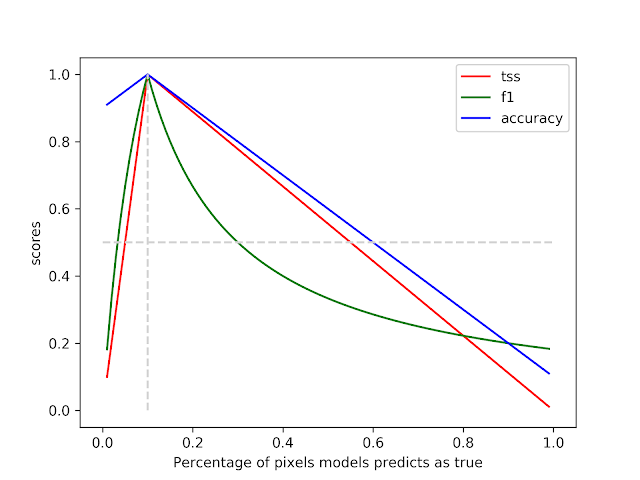
TSS versus f1-measure
The above movie shows how accuracy, TSS, and f1-measure change under the assumption that a classifier has no false positives until it has classified all of a class correctly. The vertical grey line shows the actual percentage of the features having a given class versus the horizontal axis what percentage of the class is identified by the model. For example, if the true class percentage is 0.1 as shown below we see that an aggressive classifier, one that prefers creating false positives, is punished much less by accuracy and TSS than by the f1-measure. If the model to classified 20% of the examples as a true example, the accuracy and TSS is around 0.9 while the f1-measure drops to around 0.65. Selecting your metric is very important depending on if you prefer false positives or false negatives.
comments powered by Disqus