
James Marcus Hughes
Monday, October 7, 2019
Axis aligned artifacts
There are artifacts created by choosing axis aligned cuts in robust random cut forests, similar to what was noted with IsoForest..
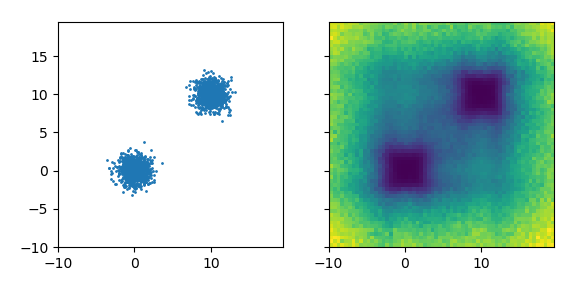
Left: Original data distribution. Right: Learned co-displacement, darker is lower.
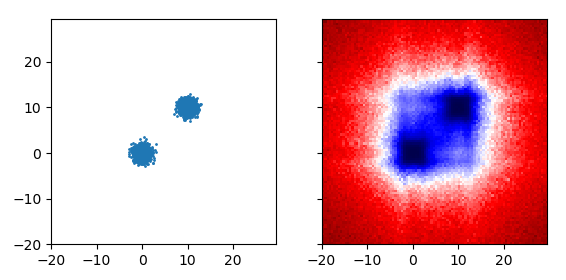
Notice the echoes around (10,-10) and (-10, 10)
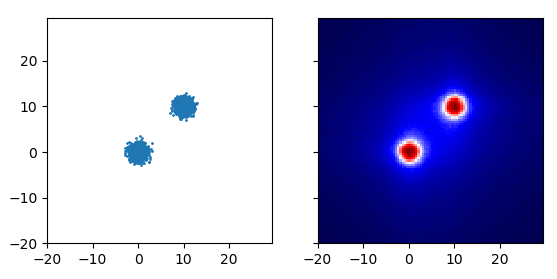
If instead of either of these, you use the depth in the robust random cut forest, you get what’s shown above. The first two examples are recreated by the code below:
import numpy as np
import pandas as pd
import rrcf
import matplotlib.pyplot as plt

include_anomaly=False
# Construct data with two modes and full of anomalies
X1 = np.random.multivariate_normal([0,0], [[1,0],[0,1]], 1000)
X2 = np.random.multivariate_normal([10,10], [[1,0],[0,1]], 1000)
if include_anomaly:
    XA = np.random.uniform(-5, 15, size=200).reshape((100, 2))
    X = np.concatenate([X1, X2, XA])
else:
    X = np.concatenate([X1, X2])

# plot the original data
fig, ax = plt.subplots()
ax.plot(X[:,0], X[:,1], '.')
fig.show()

num_trees = 300
tree_size = 256
n = X.shape[0]

# Construct forest
forest = []
while len(forest) < num_trees:
    # Select random subsets of points uniformly from point set
    ixs = np.random.choice(n, size=(n // tree_size, tree_size),
                           replace=False)
    # Add sampled trees to forest
    trees = [rrcf.RCTree(X[ix], index_labels=ix) for ix in ixs]
    forest.extend(trees)

# prepare grid for codisp measurement
xvals, yvals = np.arange(-10, 20, 0.5), np.arange(-10, 20, 0.5)
nx, ny = len(xvals), len(yvals)
xv, yv = np.meshgrid(xvals, yvals)
codisp = np.zeros((nx, ny))

# measure codisp across space
for i in range(nx):
    for j in range(ny):
        temp = []
        for tree in forest:
            point = np.array([xv[i,j], yv[i,j]])
            tree.insert_point(point, index='test')
            temp.append(tree.codisp('test'))
            tree.forget_point('test')
        codisp[i,j] = np.mean(temp)

# plot codisp
fig, axs = plt.subplots(ncols=2, sharex=True, sharey=True)
axs[0].plot(X[:,0], X[:,1], '.', ms=2)
axs[0].set_aspect(1)
axs[1].imshow(codisp, origin='lower',
         extent = [np.min(xvals), np.max(xvals), np.min(yvals), np.max(yvals)])
fig.show()
fig.savefig("bias.png")
comments powered by Disqus