The Value of a Peer-Reviewed Activity
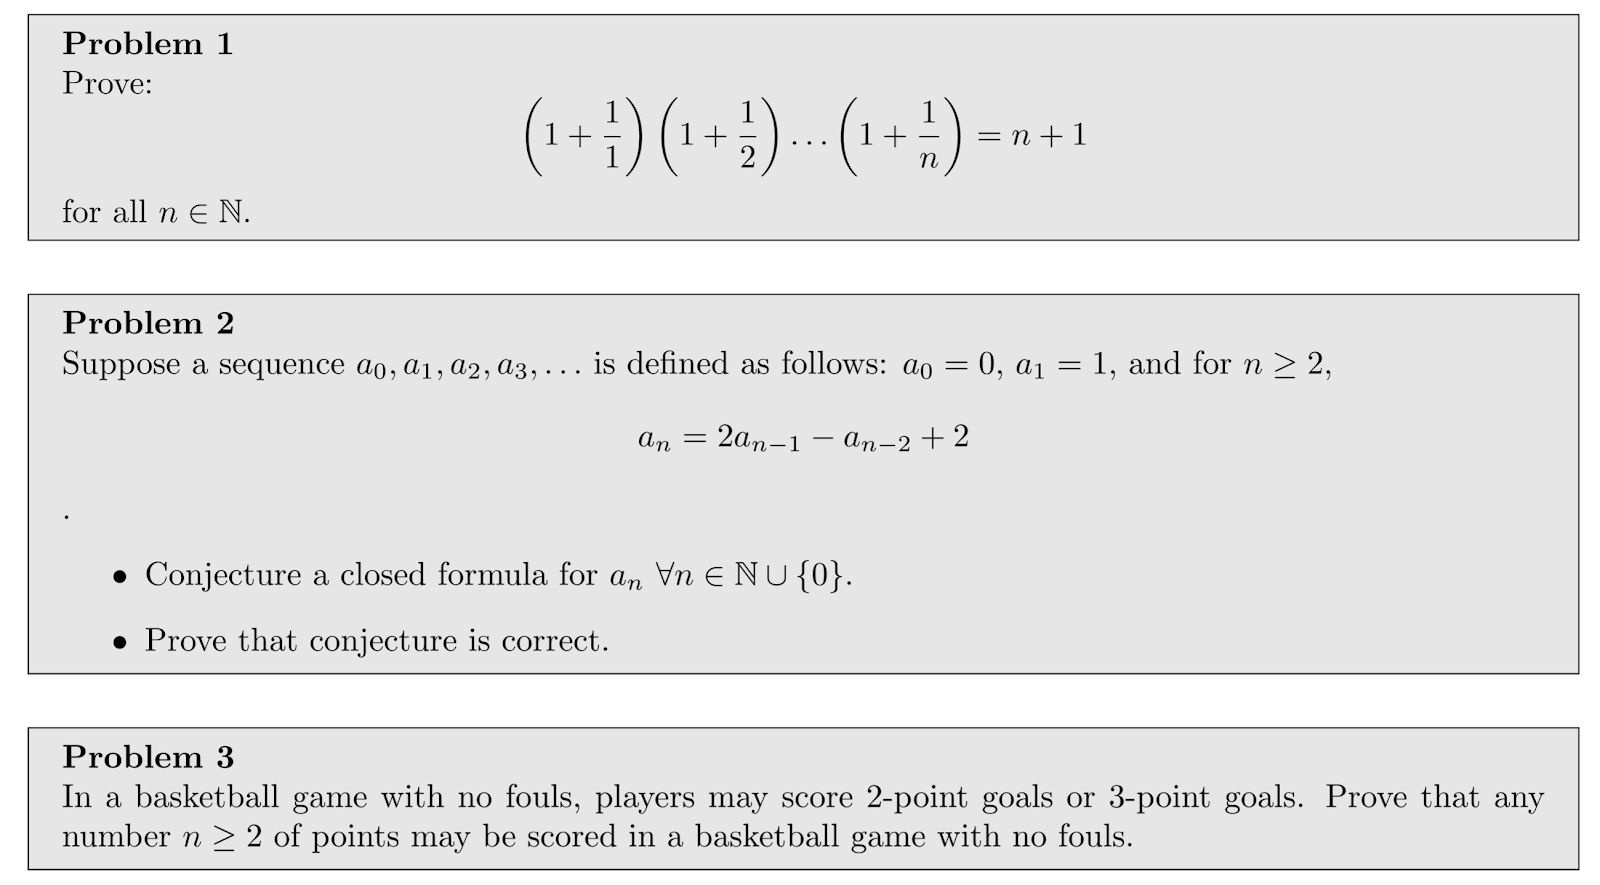
This week, we have been talking about proof writing in the discrete mathematics course I'm teaching. Yesterday, I started class by having students answer how confident they are about their proof writing skills on a scale of 1 to 10, 1 being "clueless and not sure where to start", 5 being "Okay and ready for homework," and 10 being "I can do most any proof you throw at me with ease." I then had them individually complete three proofs in 15 minutes.

Many students struggled with Problem 2 because they are not comfortable with sequence notation. Some misunderstood Problem 3 and tried proving something completely different than intended. After 15 minutes, they traded papers (with anonymous codes instead of their names so there was no embarrassment) and reviewed each someone else's papers as we went over them in class. They wrote some lovely, encouraging comments to each other. For example, one student had no idea of what to do on the second problem so they left it blank and their reviewer wrote, "Bet you can do it now! :D." Others noted where the proof failed and wrote a comment that they too had that difficulty. It's refreshing to see such kindness. Finally, they took the same survey about their proof writing again and there were dramatic changes in confidence.

Many more students were confident in their abilities. I'm not sure who the one who reported 1 after the exercise is. I hope they come to office hours.
This is in no way a rigorous test, but students expressed they learned more from this exercise because it forced them to think about the material instead of just going through the proof together on the board. I imagine there is a psychological benefit of seeing how someone else is doing too and being kind to them in written comments. It was also suggested that I do a problem example in class without proving it before class so students could hear my raw thought process first hand. I'll have to think about that. I like being prepared, but I'm sure I could find some way to do that.
# set up the data
=
= # pre exercise confidence
= # post exercise confidence
# weighted average of confidence
=
=
# figure generation
, =